Since attending the GAFE PD at Sacred Heart a couple of weeks ago, algorithmic thinking has been on my mind (yes, I am a total nerd!). I attended a session with the fabulous, Dr Rebecca Vivian that focused on how to implement algorithmic thinking in practical ways.
We’ve been studying number patterns in Mathematics so this workshop was brilliant timing, allowing me to implement ideas straight away. We’ve also been focusing on writing information reports. An idea began to boil in my mind… what if instead of designing success criteria, students could use algorithmic thinking to create a flow chart for a successful information report.
I decided that I would attempt this task through Literacy Rotations. This meant that while other students were engaged in their specific rotational task, I could explicitly teach students in small groups about flow charts and the symbols… and it would link with the algorithmic work we were doing in Maths… even better!
I distributed to the students a template of the flow chart symbols (an example of the symbols but my example was much simpler) accompanied by an information report work sample (from ACARA work samples) which we’d previously studied and labelled.
As a small group, we then worked through the symbols and their meanings and I modelled how they might start their flow chart (Are you writing about something people will want to read? Yes? No?). In their small group, students then continued these draft diagrams. Here’s an example of a starting point.

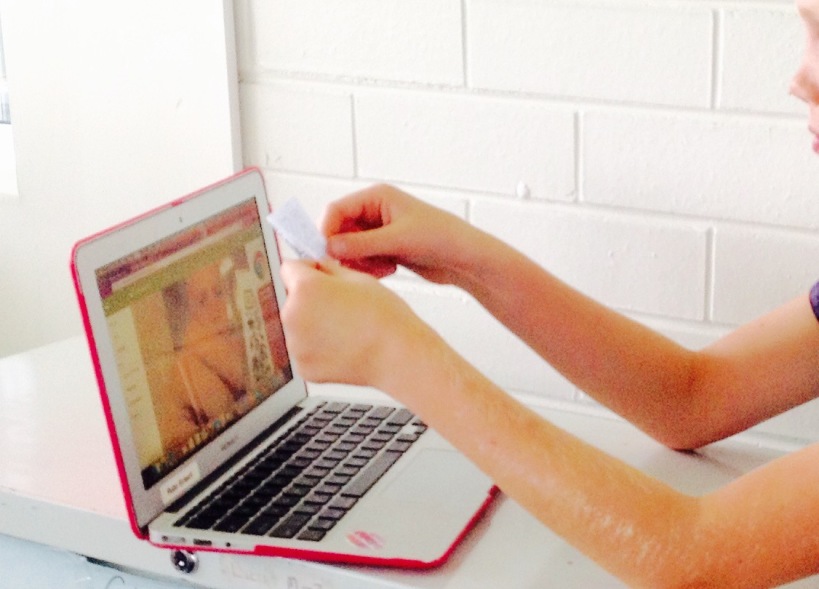
From here, students began using the drawing tool in Google Docs to create flow charts that could be added to and adjusted more easily. Check out the example below:

This continues to be a work in progress and these flow charts will develop as we continue to delve deeper into interesting and effective information report writing.